Data Visualisation in VR - Work in Progress
This project is currently in development, but I've been granted permission to share some of the process here.
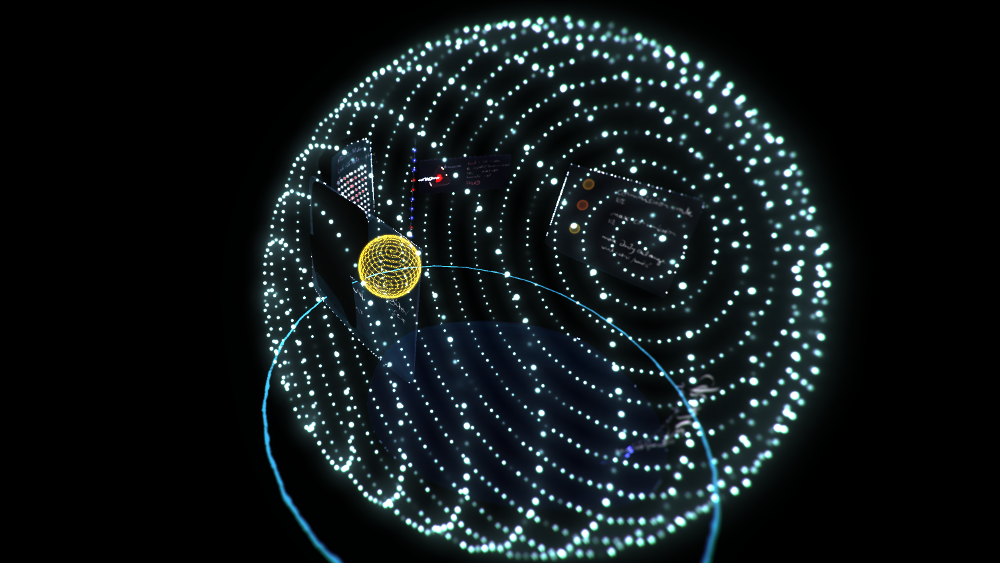
The VR data visualisation app in progress aims to allow users to access complex financial data in an immersive environment and identify risks and opportunities in real time.
Our remote team collaborate via social VR, and our design process makes use of immersive 3D tools.

Rapid prototyping
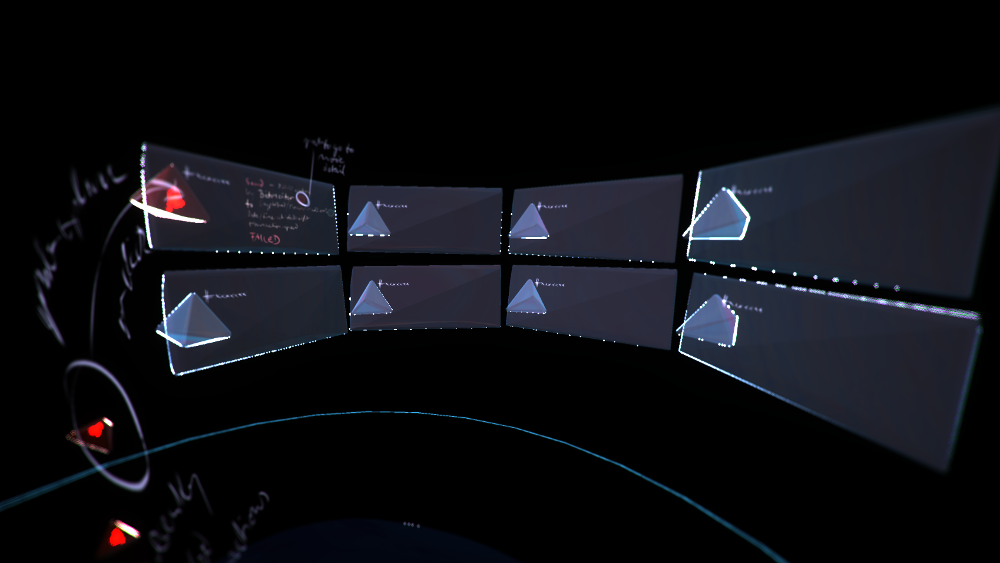
Our prototyping process is unique in that it is both remote and immersive. We use NEOS VR to communicate, and VR tools like Google Tiltbrush to sketch out dashboards and wireframes.
Being able to work within a 3D space allows us to identify possible usability issues early on.

User research
We conduct extensive user research to identify what is important to users, and if our designs fulfil their requirements.
This is particularly important in a new, immersive medium, where hardware issues and user comfort need to be consideren in addition to more standard UX aspects.
Data visualisation
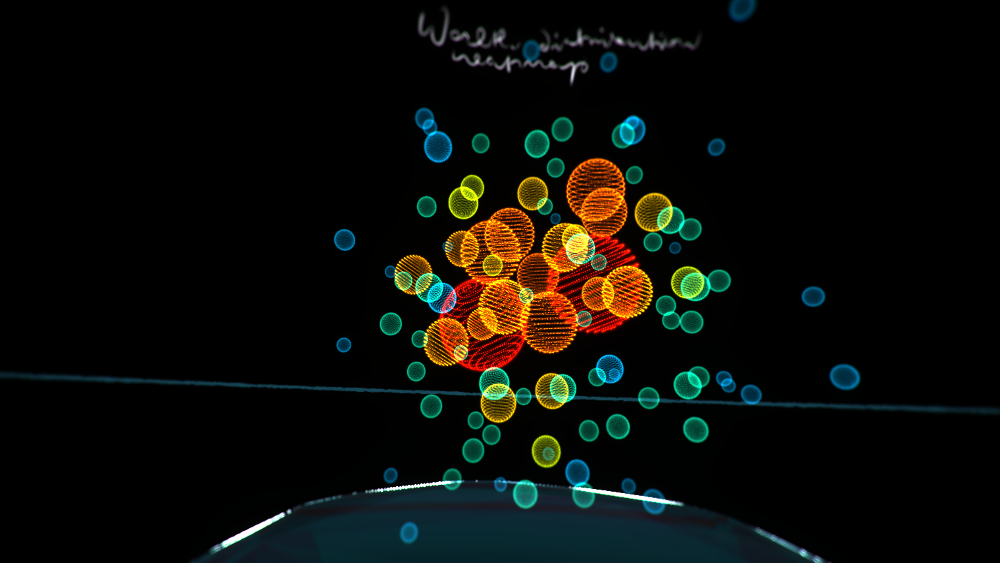
Visualising data in an immersive environment poses a challenge - how to make the visualisation realiable and useful, while also engaging with the spatial aspect of VR.
We are experimenting with a number of prototypes, taking into account spatial perception and perspective, scale, data parsing methods, user experience and branding.
